Hosted LA Tech Week Event

P3 Index

Finding the cities ready to partner

UX Research

Product Strategy

Product Design

P3INDEXCase studyVisit p3index.com ↗

Where public partners are ready to build.

Propertize is a boutique master developer from the New York area, building sports-anchored, mixed-use entertainment districts with cities across the US. In a public-private partnership the city is a financial partner, so picking the right city matters as much as picking the right site.

I led the strategy, research and design of the P3 Index, a proprietary tool that rates 301 US cities on their capacity to partner.

0
US cities rated
0
states and DC
0
reach Tier 1 or 2
5
scoring categories
BEST CITY TIER, BY STATEHover a state
AK
ME
WI
VT
NH
WA
ID
MT
ND
MN
IL
MI
NY
MA
OR
NV
WY
SD
IA
IN
OH
PA
NJ
CT
RI
CA
UT
CO
NE
MO
KY
WV
VA
MD
DE
AZ
NM
KS
AR
TN
NC
SC
DC
OK
LA
MS
AL
GA
HI
TX
FL
Select a state
PrimeStrongViableMarginalWeakNo city in range
Client
Propertize Ventures
Product
P3 Index
My role
Product strategy, research, UX & UI
Focus
Sports-anchored mixed-use P3 districts
01The problem

A P3 is only as strong as the public partner behind it.

The facts that decide a city's capacity to partner (its credit, its tax base, its incentive tools) live in a dozen disconnected places, in different formats, on different scales. Most developers judge them one deal at a time. Pursuit capital gets spent before anyone knows if the city can deliver.

Financial
Economy
Incentives
Market
Livability
100
75
62
31
72
Moody'sAaaS&P GlobalAA+FitchAAKBRAAA-MSRB EMMAPDFBond BuyerNewsCity budgetsPDFCensus ACSAPIFREDAPIBLSCSVTIRZ reportsPDFCRA reportsPDFRentCafe$/sfCushmanPDFClimateCheck1–10Walk Score0–100FAA trafficpaxVisitor bureausReport
278.9Austin, TX · #12 of 301
18 sources · 9 formats · no common scale
Is the city financially sound?
A diversified tax base, a balanced budget outside its tax-increment districts, and strong ratings from Moody's, S&P and Fitch.
Will the economy keep growing?
Property taxes ride on population, income and jobs, so the tax base behind any incentive needs a strong future.
Is there an incentive to tap?
Tax increment financing is the largest source nationally. A program the city can borrow against, or already has, is best.
02Pain points

Two sides of the table. One shared deal.

I ran working sessions with Propertize's principals, business development and finance teams, and mapped what city managers, mayors, councils and economic development staff need to see from a partner. The same gaps showed up on both sides.

Developers
Principals, business development, finance
01
Pursuit capital at risk
Teams spend months and real money on a market before knowing if the city can carry its share.
02
Facts in a dozen places
Ratings, bond disclosures, TIF reports and budgets each live somewhere different.
03
No common scale
There's no way to compare 300 cities side by side on credit, growth and incentives.
04
Incentives differ by state
TIF, TIRZ, CRA, TAD and URA all work differently, and no vendor sells a national dataset.
05
Walking in under-informed
First city meetings start with questions the developer should already have answered.
One shared
fact base
Public partners
City managers, mayors, councils, econ dev
01
Is this partner credible?
City managers and economic development directors need proof a developer has done the homework.
02
Political calendars set the pace
Council cycles, budget seasons and elections decide when a deal can move.
03
RFPs need defensible numbers
Every assumption in a proposal must hold up in a public meeting.
04
Community benefit, not just revenue
Mayors and councils answer to residents who will live with the district for decades.
05
Thin staff, complex deals
Many cities lack the capacity to model a P3 on their own.
The insight: both sides need the same facts, just at different moments.
Developers need them before they spend. Cities need them before they vote. A shared, sourced view of credit, growth and incentives turns the first meeting into a working session instead of a sales pitch.
03Research approach

Evidence before interface. Every number needs a source.

Before designing a single screen I mapped the decisions, the people making them, and the data that could support them honestly. I wrote the product strategy that set the rubric, the audiences and the experience principles.

01
Listen
Working sessions with principals, business development, finance and capital partners to define who decides what, and when.
02
Map the public side
How city managers, councils and economic development staff evaluate a partner, from RFPs, agendas and public reports.
03
Audit every source
Inventoried 53 sources: 17 free APIs, 20 public datasets and 16 paid data categories, plus partnership options.
04
Design the rubric
Started from three categories (finance, economy, incentives), grew to five with market and livability, each traceable to inputs.
05
Prototype and verify
A working app on real data for 301 cities, with automated range checks and hand-verified ratings.
Data coverage
cities covered of 301
Population, 2025 & 2020301
Income, poverty, education300
Walk, Transit, Bike Score299
Airports & passengers296
Sales & property tax292
Hospitals278
Climate risk259
Colleges & enrollment231
Multifamily rent228
Stadiums, arenas, venues138
Metro unemployment127
Annual visitors122
GO credit ratings97
Major-league teams54
Credit ratings were the biggest gap, so the app flags provisional scores instead of hiding them. Silver bars mark the inputs still being filled.
No one sells this dataset
Estimated share of Index inputs each option supplies. TIF data has to be researched city by city.
Best 3-vendor stack~95%
Moody's (Analytics + CRE)~65%
Free public sources~60%
S&P Global~50%
Bloomberg~45%
CoStar~30%
Esri BA~25%
Placer.ai~20%
Our estimates from the vendor evaluation, not vendor claims.
04Thinking it through

Before any screen, a sheet of paper.

I worked out the structure by hand first: where each fact lives, how to put credit, growth and incentives on one scale, and what a team should see the moment they open a city. These sketches became the rubric and the city profile.

How does a city prove it's ready?where does it all live?ratings (3 agencies!)city budgets / ACFRsTIF reports... PDFsCensus, BLS, FREDrents + vacancyclimate, walk, transitteams, venues, visitorsno common scalenormalize everything → 0 to 100FinEconIncMktLiv3 buckets?5. add market + livabilityP3 scoreyour weights, your strategyFinEconIncMktLivthe user decidesAustin, TX278.9answer FIRSTshow the mathflag gaps, don't hide themprovisionaltiers, not decimals1 = go see itTIF = the missing piecenobody sells it nationally“click Tampa, see why”How does a city prove it's ready?where does it all live?ratings (3 agencies!)city budgets / ACFRsTIF reports... PDFsCensus, BLS, FREDrents + vacancyclimate, walk, transitteams, venues, visitorsno common scalenormalize everything → 0 to 100FinEconIncMktLiv3 buckets?5. add market + livabilityP3 scoreyour weights, your strategyFinEconIncMktLivthe user decidesAustin, TX278.9answer FIRSTshow the mathflag gaps, don't hide themprovisionaltiers, not decimals1 = go see itTIF = the missing piecenobody sells it nationally“click Tampa, see why”
CHARCOAL2BP3 · NO. 557
A recreation of my early working sketch: sources in, five categories, one score, and the city card it all had to answer to.
05The benchmark

Learning from the developers who define the category.

Drawing on my work alongside large-scale corporate development teams, I studied how the country's leading mixed-use developers pick markets and structure districts with their public partners. The Index brings that discipline to a growing developer, before the first site visit.

Related Companies
Hudson Yards, New York
Scale and a public-private infrastructure model
Brookfield Properties
Manhattan West, New York
Long-hold, mixed-use placemaking
Hines
Global mixed-use developer, Houston HQ
Institutional-grade underwriting
Tishman Speyer
Rockefeller Center, New York
District programming and operations
The Cordish Companies
Texas Live!, Arlington
Sports-anchored entertainment districts
Studied for reference. Names belong to their owners; no affiliation implied.
06The Index

Your strategy, your weights.

Five categories, each built from sourced inputs and scored 0 to 100. Every team weighs them differently, so the ranking re-sorts live as priorities change. Try it below with the real scores for the top 24 cities.

WeightsDEFAULT
Austin ranks #12 of these 24 at this mix.
#CityCreditIncentiveTierScore
1Atlanta, GAAA+TAD1Prime87.9
2Fort Worth, TXAA-TIRZ1Prime83.6
3Denver, COAAADURA TIF1Prime83.4
4Nashville, TNAARedevelopment Districts1Prime83.0
5Huntsville, ALAA+TIF1Prime82.2
6Salt Lake City, UTAAACRA1Prime81.1
7Henderson, NVAA+None found1Prime80.4
8Alexandria, VAAAATIF1Prime80.1
9Charlotte, NCAAASTIG/TIG2Strong79.7
10Orlando, FLAA+CRA2Strong79.7
11Oklahoma City, OKAAATIF2Strong79.0
12Austin, TXAAATIRZ2Strong78.9
13Georgetown, TXAAATIRZ2Strong78.1
14Washington, DCAA+TIF2Strong77.7
15San Francisco, CAAA+IFD2Strong77.5
16Indianapolis, INAAAMDC2Strong77.5
17Plano, TXAAATIF/TIRZ2Strong77.4
18Raleigh, NCAAATIRP2Strong76.5
19Miami, FLAACRA2Strong75.8
20Dallas, TXA+TIF2Strong75.6
21San Antonio, TXAAATIRZ2Strong75.0
22Tampa, FLAAACRA2Strong75.0
23League City, TXAA+TIRZ2Strong74.0
24Richardson, TXAAATIF2Strong73.4
All 301 cities, by tierdefault weights
8
24
36
49
184
1 · Prime
80+
2 · Strong
70–79
3 · Viable
60–69
4 · Marginal
50–59
5 · Weak
under 50
Only 32 cities (about one in ten) reach Tier 2 or better. That's the point: the Index narrows a national search to a shortlist worth a site visit.
07The product

Quiet, fast, and built to be checked.

A black-and-white interface with one job: get a team from a national list to a defensible shortlist. Rankings, city profiles, the rubric and the data sources are each one click away, on desktop and on a phone between meetings.

p3index.com
Rankings screen
City profile screen
Rubric screen
Data screen
All 301 cities, ranked and tiered, with credit, incentive program and category scores side by side.01 / 04
Phone · Rankings
9:41
Phone · City
9:41
P3INDEX
Built responsive from day one.
The table becomes a ranked list on a phone, and the city profile becomes a single scrolling page, so a principal can check a city between meetings.
Visit the P3 Index site ↗The live app sits behind a sign-in for the Propertize team.
08Click a city, see why

Austin, Texas. Answer first, then the math.

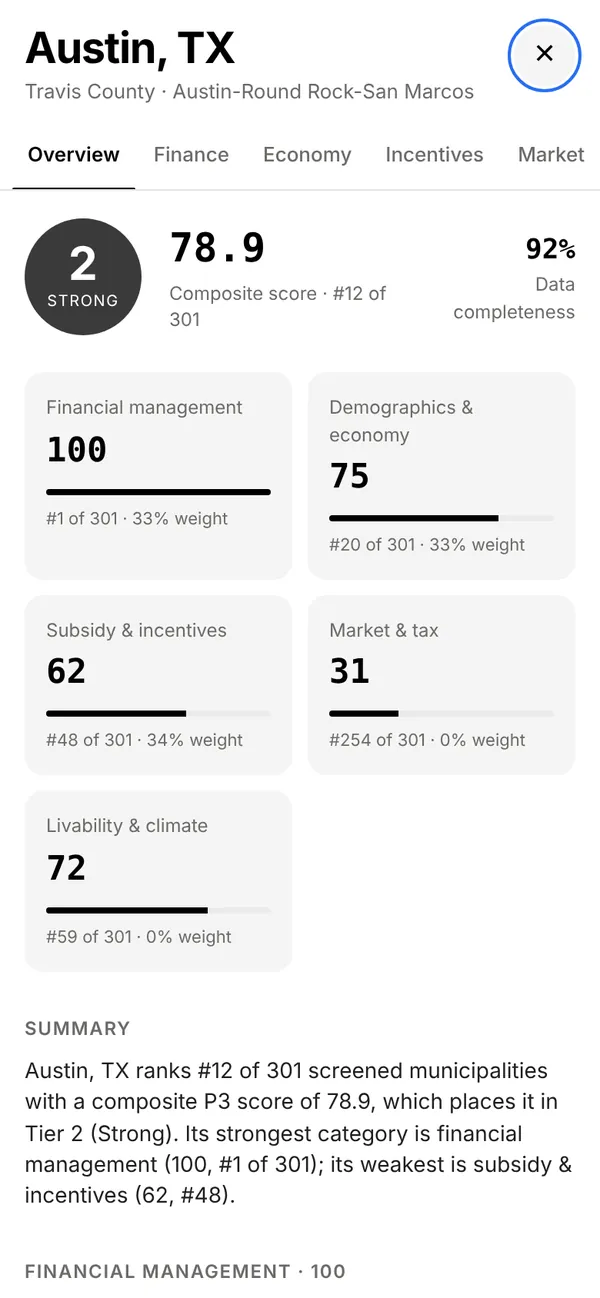
The city profile leads with the verdict: tier, score and rank. Every category opens into the inputs behind it, with the source and date on each one. Gaps are labelled, never hidden. This is Austin's profile, recreated from the app.

P3INDEX
Search 301 citiesExport brief
Austin, TX
Pop. 1,002,632 · +4.2% since 2020
92% complete
2STRONG
78.9
Rank #12 of 301 · Tier 2
Financial capacity
100#1
Economic strength
75#20
Incentive tools
62#48
Real estate market
31#254
Livability & access
72#59
WHYAaa · AAA · AAA from all three agencies, outlook stable.
TEXAS PEERS
Fort Worth83.6
Austin78.9
Georgetown78.1
Plano77.4
Dallas75.6
San Antonio75.0
GO credit
AaaAAAAAA
Moody's · S&P · Fitch, stable
Incentives
4 TIRZ
Plus PIDs and Ch. 380 deals. Capped at 10% of appraised value.
Economy
$93,658
Median household income. 59.6% hold a bachelor's.
Anchors
AUS passengers21.7M
Q2 Stadium20,738 seats
UT Austin53,665 students
Climate
Heat · highFire · highFlood · modDrought ↑
Why Austin is strong
Top marks for finance: triple-A from all three agencies and a deep incentive toolkit across four reinvestment zones.
What holds it back
The market score ranks #254 of 301, so the deal needs a story beyond rent growth.
What to ask the city
With deficits projected at $64M and $71.4M for the next two years, how will new increment be shared?
09Cities & communities

Districts are built for people. So the data starts there.

A council votes on what residents will live with for decades. So the Index carries community data from the same public sources city staff already trust, in plain language a resident could follow.

Two people talking at a community working session
Show residents what they get, not just what the project earns.
The public-side test for every screen
300 / 301
cities with Census income, poverty and education data, one of the most complete layers in the Index.
Jobs close to home
Unemployment, income, education
→
Getting there without a car
Walk, Transit and Bike Score
→
Homes people can afford
Multifamily rent, poverty rate
→
Safe from heat and flood
Climate risk by hazard
→
Care nearby
Hospitals and access
→
What communities ask for, and the measure the Index uses to answer it.
10How it connects

From scattered sources to a deal everyone can see.

The Index is the middle of the system. Data flows in from public and licensed sources, gets normalized and scored, and flows out to the three groups who have to agree before a district gets built.

IN · 53 SOURCES
Credit & fiscal
Ratings, budgets, bond disclosures
Economy
Census, BLS, FRED
Incentives
TIF, TIRZ, CRA reports
Real estate
Rents, vacancy, supply
Anchors & access
Teams, venues, airports, climate
P3INDEX
01Normalize to a 0–100 scale
02Weight five categories
03Rank and tier 301 cities
04Trace every input to a source
05Flag gaps as provisional
OUT · 3 AUDIENCES
Public partners
A shared, sourced brief for the first city meeting and the RFP response.
Financial tools
Increment capacity, bond headroom and a first-pass pro forma.
Capital partners
Investment-committee-ready exports with every input traced.
Tax increment financing
Estimate the increment a new district could generate and what share the city can pledge.
Bonds and credit
Read the city's rating and outstanding debt to gauge borrowing room.
Pro forma
Turn a site into a first-pass budget, income and value in one view.
11From city to site

A first look at a deal, in one screen.

Once a city makes the shortlist, the estimator turns a candidate site into a budget, an income picture and a value, using local construction and rent assumptions. It's the start of underwriting, not the end.

Riverside Crossing
Illustrative site · Austin, TX · Mixed-use, 4 stories
64 apartments54,000 GSF9,500 SF retail
BUDGET
Construction
$255–320 / SF
$13.8–17.3M
Soft costs & fees
+25–30%
$3.4–5.2M
Total, excl. land
$17.2–22.5M
Cap rate5.75%
Stabilized value
$19.14M
Yield on cost 4.9–6.4%
INCOME, YEAR ONE
Potential income$1,820,600
Vacancy 7%−$127,442
Operating costs 35%−$592,605
Net operating income$1,100,553
Apartments
64 × $1,950 / mo
Retail
9,500 SF × $34 / yr
Fictional site and illustrative assumptions for this case study. Not an appraisal or investment advice.
12Aligning the timeline

Two calendars. One plan.

A sponsored P3 moves at the pace of the public process: work sessions, procurement, term sheets and votes. The Index lets the developer front-load the homework, so the first meeting already speaks to the city's credit, incentives and community goals, and the RFP response is built on the same facts the council will see.

Discover
Months 0–2
Procure
Months 3–6
Negotiate
Months 7–12
Approve & build
Months 13–18
Public partner
Council work session
RFQ / RFP issued
Developer selectedTerm sheet & TIRZ plan
Council voteGroundbreaking
Developer
Screen 301 citiesShortlist & city briefFirst meeting, data in hand
RFP response
Underwrite & partner
Close financing
The Index does its work in the first column, before the city issues its RFP.
Strategy
Target cities whose credit, incentives and goals fit the district before pursuit capital is spent.
RFPs
Answer with sourced numbers the city can verify, in the order a council will ask.
Timelines
Plan around budget cycles and votes, not against them.
Representative sequence. Every city's process and pace differs.
13Why it wins

Everything a P3 screen needs. In one place, for the first time.

The research made one thing clear: no single vendor covers it. Credit lives with the rating platforms, rents with the real estate data firms, foot traffic with location analytics, and incentive programs with nobody. The Index brings all of it into one score a team can act on.

CAPABILITY
P3INDEX
Credit platforms
Moody's, S&P, Bloomberg
Real estate data
CoStar
Location analytics
Esri, Placer.ai
Public data
Census, BLS, FRED
GO credit ratings, all agencies
City budgets and structural balance
TIF, TIRZ and incentive programs
Population, income and jobs
Rents and market strength
Livability, climate and access
Teams, venues and visitors
One P3 score, 1–5 tiers
Your weights, live re-ranking
Every input traced to its source
City brief ready for the first meeting
Full coverage
0/11
1/11
1/11
1/11
2/11
Full Partial Not offeredOur assessment from the vendor evaluation, by category.
Months → minutes
A national screen that took a team months of calls and spreadsheets now takes a few minutes.
3 vendors, ~95%
Even the best three-vendor stack only gets close, and still leaves incentive data to be researched by hand.
$58K+ a year
List-price context for comparable seats (Bloomberg, Capital IQ, CoStar), before any research time.
14Outcome

A months-long screen, now minutes.

The P3 Index gives a growing developer the market discipline of the largest firms: a national view of where public partners are ready, a sourced reason for every rank, and a shared fact base to bring to the table.

01
Answer first
Tier, score and rank before any detail.
02
Show the math
Every number opens to its inputs and source.
03
Honest about gaps
Missing data is flagged as provisional, never filled in.
04
Your weights
The ranking follows the team's strategy.
05
Quiet, fast, premium
Black and white, one accent, nothing in the way.
Now
Five categories, 301 cities, live weights and city profiles.
Next
Licensed credit and fiscal data to close the ratings gap.
Then
A sports and visitor layer from foot-traffic data.
Later
Data partnerships with cities for TIF and district reporting.
Stadiums don't build districts.
Partnerships do.
P3INDEX

Want to
see more?

Reach out to view more of my portfolio work – including projects from Disney, Wolf & Shepherd, Franklin Templeton, Block One, and JPMorgan.

Current availability

We’re open for business and new collaborations.

Current availability

We’re open for business and new collaborations.